Anesthesiologist Pay Report, Q3 2026: What Job Postings Show
By Andrew Woodmancey, Managing Director · Published
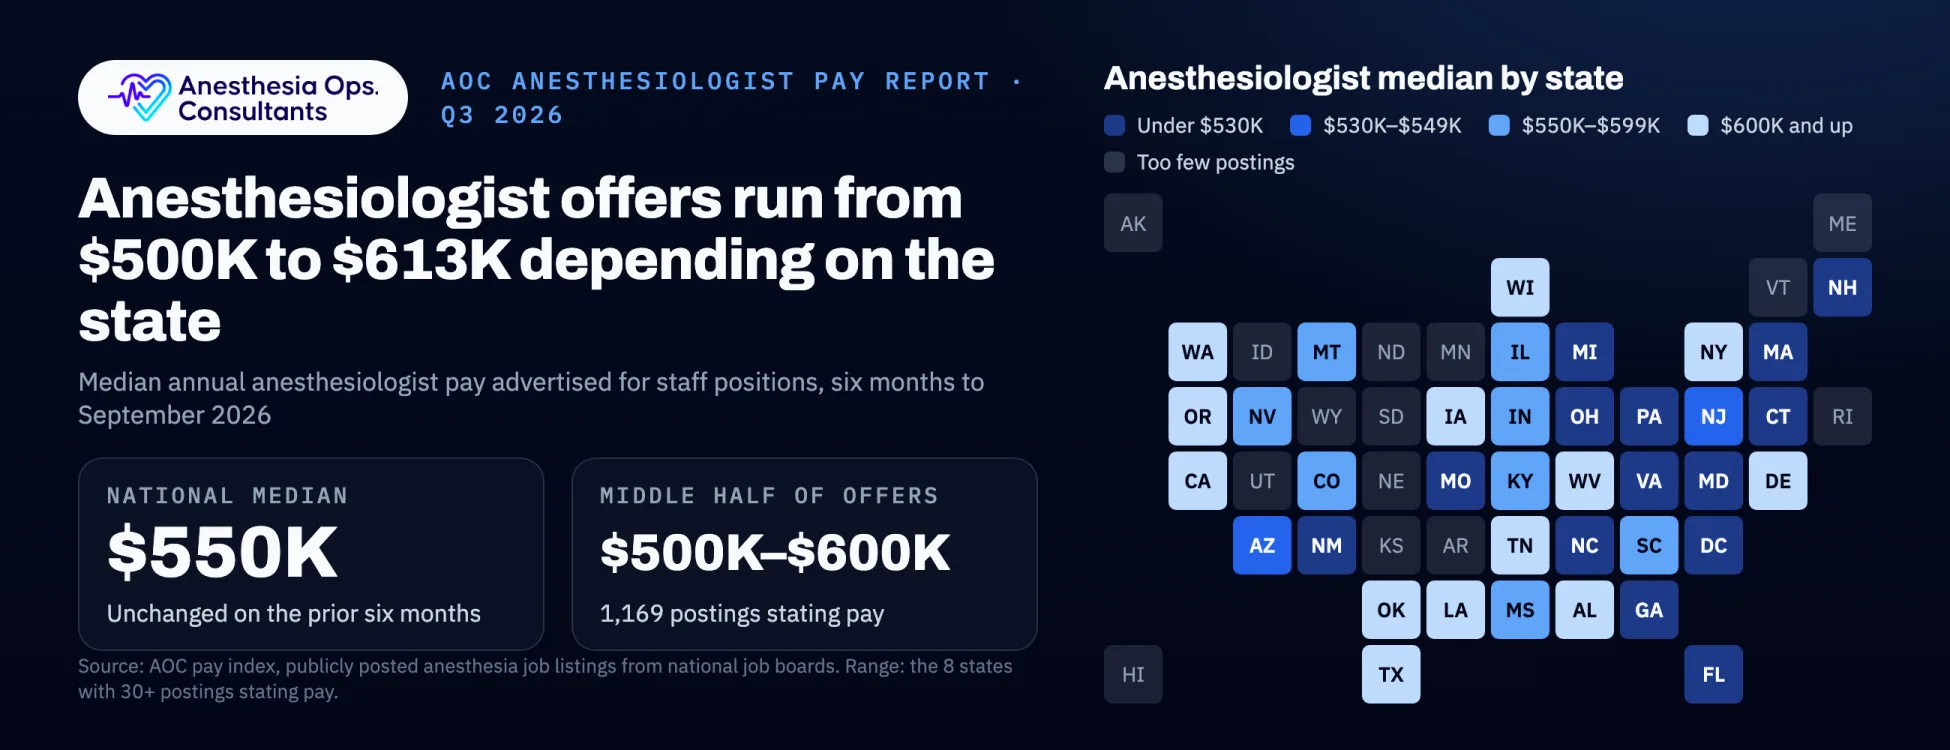
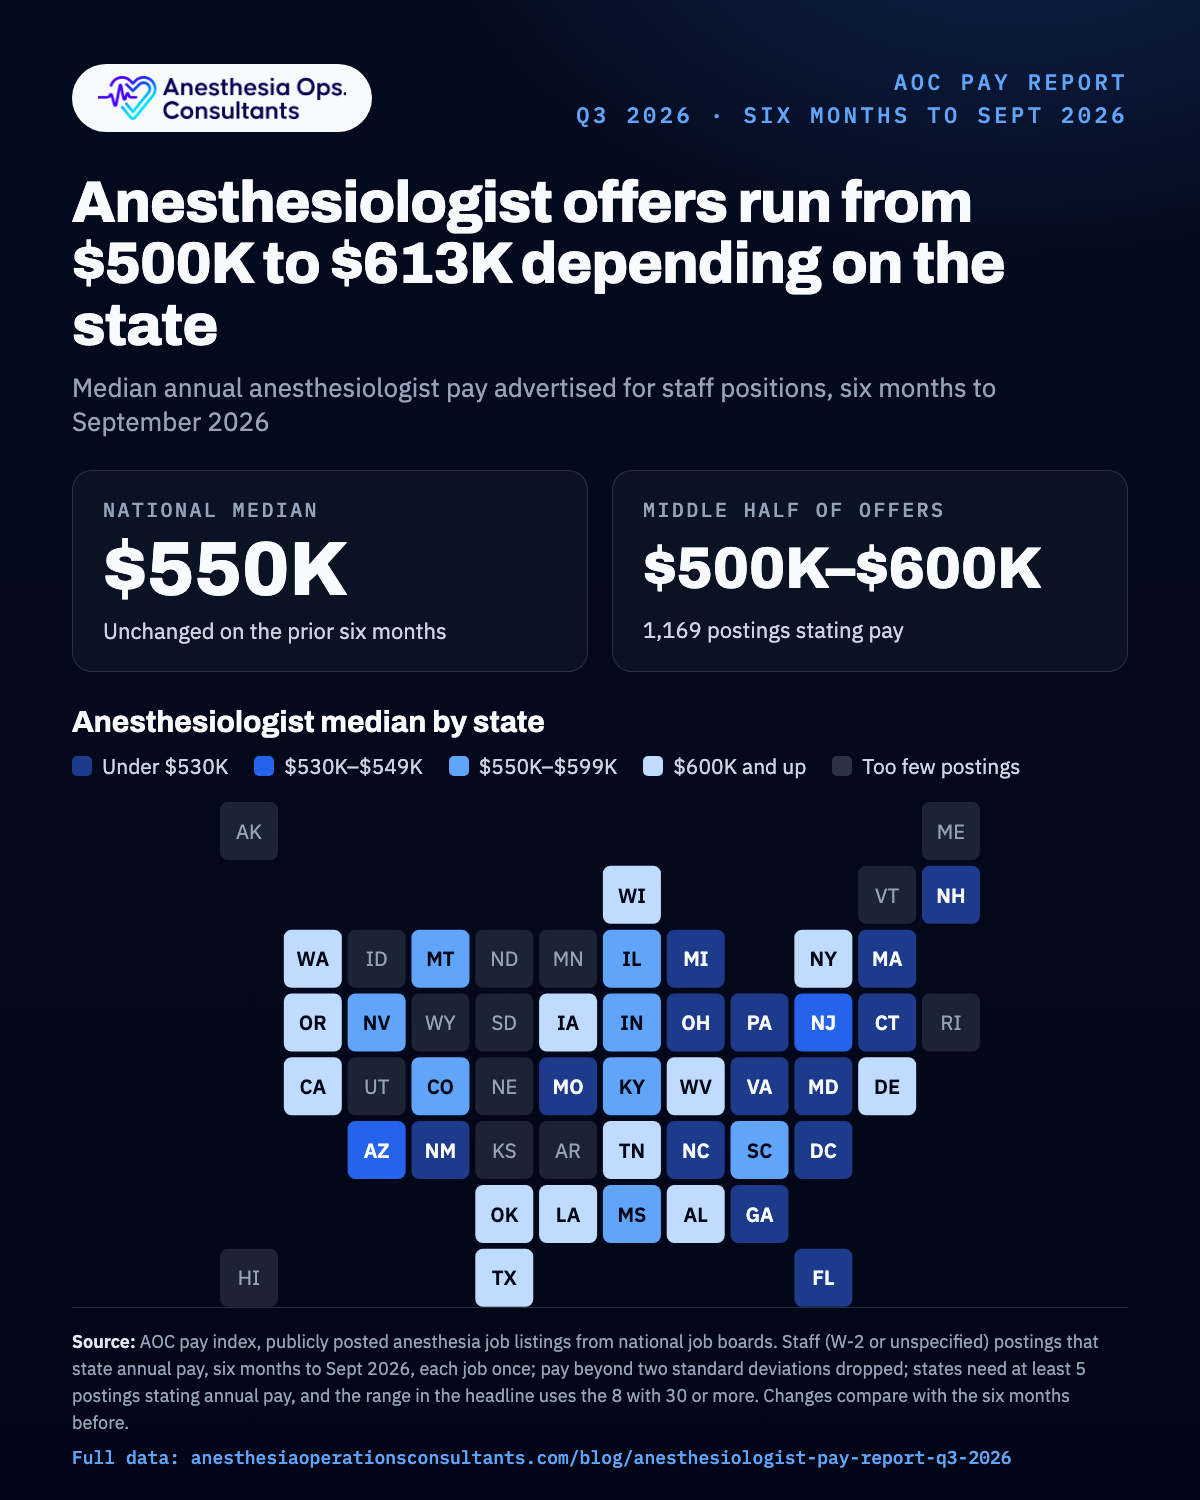
The short answer: in staff (W-2 or unspecified) anesthesiologist job postings that stated pay over the six months to September 2026, the median offer was $550,000 a year, unchanged on the six months before (October 2025 to March 2026). The middle half of offers ran from $500,000 to $600,000.
- Physician pay has stopped rising. The national median is unchanged on the prior six months, while CRNA pay rose about 4%.
- Where you hire matters more than when. State medians differ by up to 40%, and regions run from $515,000 (South Atlantic) to $612,500 (Pacific). Test a renewal ask against your own market, not the nation.
- What to ask for. A request built on rising physician salaries needs evidence that posted pay does not show. Each $10,000 of anesthesiologist pay costs about $15,000 a year per location an anesthesiologist covers alone, and about $5,000 per room at 1:3.
Every state’s anesthesiologist median is in the tables below, with its region’s figure where a state has too few postings.
This is AOC’s quarterly anesthesiologist pay report for Q3 2026. The CRNA figures for the same period are in the CRNA pay report for Q3 2026: a median of $280,000, up about 4% on the prior six months.
For a hospital paying for anesthesia coverage, physician pay is the steadier figure: posted anesthesiologist pay has not moved from the prior six months, while CRNA pay rose about 4% on the prior six months. A renewal ask built on rising physician salaries needs to show where that is happening.
What it means for your budget
A location has to be covered every day it runs. With about 1.25 full-time clinicians per location to cover 250 days a year with breaks and relief, and 20% for benefits, every dollar of pay costs about $1.50 a year per location.
At the national median, an anesthesiologist covering a location alone costs about $825,000 a year; directing three CRNA rooms, about $275,000 per room, with the CRNAs on top (what each care team ratio costs).
- Ask what is behind a physician-pay increase. Posted anesthesiologist pay has not moved from the prior six months. A request built on rising physician salaries needs to show where that is happening.
- Use your state’s figure. Anesthesiologist medians differ by up to 40% between states; the tables below show where your market sits.
- Check the raise your group assumes. Put it into the state finder above: it compares the raise with what posted pay did in your region and prices the difference per location.
- Price the locums dependence. If open shifts are being filled hourly or through locums, that rate, not the salaried median, is what the schedule really costs. It is often the larger lever in a subsidy than base pay (what locums anesthesia costs).
To see what these pay levels mean for the cost of your own coverage, a benchmark review starts from these medians and your own schedule and payer mix. Our explainer on anesthesia subsidies covers how pay feeds the support a hospital pays its group, and the 2027 Medicare conversion factor covers the revenue side of the same gap.
Pay by region
The national median hides how much pay differs by region. Grouped into the nine Census divisions, anesthesiologists are offered from $515,000 at the median in the South Atlantic division to $612,500 in the Pacific division. The biggest moves on the prior six months: the Mountain division up about 9% ($500,000 to $545,000) and the Pacific division up about 4% ($587,500 to $612,500). A division pools every posting in its states, so it also gives a figure for states with too few postings of their own.
| Region | States | Median | Postings stating pay | vs prior six months |
|---|---|---|---|---|
| Pacific | AK, CA, HI, OR, WA | $612,500 | 115 | +4% |
| West South Central | AR, LA, OK, TX | $600,000 | 155 | +4% |
| Middle Atlantic | NJ, NY, PA | $550,000 | 280 | no change |
| East North Central | IL, IN, MI, OH, WI | $550,000 | 206 | no change |
| East South Central | AL, KY, MS, TN | $550,000 | 62 | no change |
| Mountain | AZ, CO, ID, MT, NV, NM, UT, WY | $545,000 | 65 | +9% |
| New England | CT, ME, MA, NH, RI, VT | $525,000 | 47 | no change |
| South Atlantic | DE, DC, FL, GA, MD, NC, SC, VA, WV | $515,000 | 214 | −2% |
| West North Central | IA, KS, MN, MO, NE, ND, SD | $512,500 | 24 | – |
How hard it is to hire
Pay is half of what coverage costs; the other half is whether the schedule can be filled with staff. Over the six months to September 2026, 5,075 anesthesiologist openings were posted, about 6 for every 100 anesthesiologists, and 50% of them were locums or contract work. The tightest markets: the South Atlantic division (8.6 openings per 100, 52% locums or contract) and the Middle Atlantic division (6.7 openings per 100, 44% locums or contract). Where both figures are high, expect a group to lean on locums and to price open shifts at locums rates, which is often the bigger lever in a subsidy than salaried pay.
Pay by state
State medians cover the six months to September 2026 and include every state where at least 5 postings stated pay: 37 states. Figures with fewer than about 30 postings behind them are directional. The change column compares each state with the prior six months where both periods have at least 10 postings stating pay.
All 37 states: median, postings and change
| State | Median | Postings stating pay | vs prior six months |
|---|---|---|---|
| Oklahoma | $700,000 | 5 | – |
| Delaware | $637,500 | 6 | – |
| California | $612,500 | 81 | +4% |
| Alabama | $612,500 | 7 | – |
| New York | $600,000 | 142 | +2% |
| Texas | $600,000 | 133 | no change |
| Wisconsin | $600,000 | 25 | – |
| Tennessee | $600,000 | 19 | – |
| Louisiana | $600,000 | 16 | – |
| Washington | $600,000 | 15 | – |
| Oregon | $600,000 | 14 | – |
| Iowa | $600,000 | 5 | – |
| West Virginia | $600,000 | 5 | – |
| Indiana | $575,000 | 28 | +5% |
| South Carolina | $575,000 | 11 | – |
| Illinois | $550,000 | 107 | no change |
| Kentucky | $550,000 | 29 | – |
| Colorado | $550,000 | 13 | – |
| Montana | $550,000 | 10 | – |
| Nevada | $550,000 | 6 | – |
| Mississippi | $550,000 | 5 | – |
| New Jersey | $535,000 | 63 | −3% |
| Arizona | $530,000 | 29 | −8% |
| Pennsylvania | $525,000 | 77 | −12% |
| Ohio | $525,000 | 25 | – |
| Michigan | $525,000 | 24 | no change |
| Massachusetts | $525,000 | 23 | no change |
| North Carolina | $525,000 | 21 | – |
| Connecticut | $525,000 | 12 | – |
| New Hampshire | $525,000 | 9 | – |
| District of Columbia | $512,500 | 8 | – |
| Georgia | $510,000 | 25 | −7% |
| Virginia | $500,000 | 65 | +5% |
| Florida | $500,000 | 49 | −9% |
| Maryland | $500,000 | 25 | +3% |
| Missouri | $500,000 | 10 | – |
| New Mexico | $500,000 | 6 | – |
Anesthesiologist medians run from $500,000 to $700,000, a 40% spread: an anesthesiologist in Oklahoma is advertised at 1.4 times the pay of one in New Mexico. For CRNAs the spread is 71%. New Mexico shows how local these markets are: it is among the lowest-paying states for anesthesiologists and among the highest for CRNAs.
The trend over the past year
Each month’s figure is the median of the six months ending that month, so it moves only when pay across half a year moves.
Anesthesiologists: $525,000 in October 2025, $535,000 in November and $550,000 from December through September 2026.
How the openings are paid
This table counts every anesthesiologist posting in the index (26,207) by how it says the job is paid, so it measures something different from the annual-pay figures above. More than half do not say. Among those that do, salaried employment is the smallest of the three main models: daily locums, hourly and salaried.
| Pay model | Share of anesthesiologist postings |
|---|---|
| Daily locums | 15.4% |
| Hourly | 11.0% |
| Salaried | 9.0% |
| Productivity | 1.7% |
| Fee per case or partnership | under 0.5% |
| Not stated | 62.6% |
For anesthesiologists, hourly and locums postings together outnumber salaried ones about three to one. A coverage model that leans on that market pays its going rate, which is set by the openings that are hardest to fill.
How these figures compare
Other benchmarks measure different things, so they sit at different levels. AMN Healthcare’s 2026 review of physician and advanced practitioner recruiting incentives puts the average starting salary it saw for anesthesiologists at $525,000, close to our $550,000 median of posted offers. The Bureau of Labor Statistics’ May 2025 wage survey puts the median at $391,490: that is what employed anesthesiologists were paid a year earlier, across every tenure and setting, and it leaves out partners and owners of anesthesia groups, so it runs below what new postings offer. For pricing a coverage contract today, posted offers in your own market are the closer guide.
How the index is built
- Source: publicly posted anesthesia job listings from national job boards, about 2,600 anesthesiologist jobs in the six months, of which 1,169 stated annual pay.
- Pay: annual pay as posted: the salary range a posting lists (its midpoint) or a stated annual salary. Hourly and daily rates are not converted, so they are not counted. Posted pay is what employers advertise, not what is finally agreed, and it leaves out signing bonuses, call pay and benefits.
- Window: figures pool the six months to September 2026, and changes compare them with the six months before (October 2025 to March 2026). Each job counts once.
- Staff positions only: postings marked locums, 1099 or partnership, or paying a daily locum rate, are left out; postings that do not say how the job is employed stay in.
- Outliers: pay more than two standard deviations from the average (nationally, or within a state or region) is dropped.
- Thin data: a national figure needs at least 100 postings stating pay in its window; a state is shown from 5 and a region from 20.
- Recruiters: about 68% of postings in the index come from recruiters, who often omit pay, which is why fewer than half of postings contribute to the pay figures.
- Cost per location: 1.25 full-time clinicians per location (250 days a year, 220 shifts each plus 10% for breaks, relief and call) and 20% for benefits, so about $1.50 a year per dollar of pay.
About this report
AOC publishes its anesthesiologist and CRNA pay reports each quarter. This one covers Q3 2026: the six months to September 2026, compared with the six months before. The next report covers the six months to December 2026.